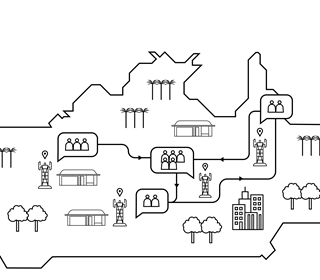
Subscriber presence indicators describe the number of subscribers recorded visiting a location in the short term, usually hourly or daily.
This is most often expressed as a change relative to a baseline, for example the median subscriber presence for the preceding three months. From this, we can draw insights about how busy different areas are and how this varies over time.
How are they calculated?
These indicators are calculated from the subscriber count aggregated by location, such as an administrative area, and time period (hour or day). These indicators can also be calculated separately for different periods, such as weekdays and weekends or day and night.
Find out more about how we calculate specific subscriber presence indicators here.
Describing other aspects of the short-term variation in subscriber presence
In addition to simply describing the change in subscriber presence, we can derive a number of different indicators to describe different aspects of this variation such as:
- Changes in the variance in subscriber presence, which may indicate disruption of regular patterns in the number of people visiting a location
- Changes in the day/night ratio in subscriber presence, which may describe the change in the number of people visiting an area during the day, relative to the number who stay there overnight, or areas with high nighttime activity.
Furthermore, we can use subscriber count aggregates to produce additional indicators describing other aspects of the short-term variation in subscriber presence, such as crowdedness and population mixing, for specific applications.
Crowdedness
Crowdedness indicators are calculated from CDR aggregates of subscriber counts. These crowdedness indicators quantify the size of the ‘crowd’ in a location at a given time and number of ‘crowds’ in a location over time. They are only calculated in urban areas where the density of cell towers enables us to calculate subscriber presence for small areas.
The size of the crowd at a location is usually calculated as the number of subscribers recorded within a small area within a 15 minute period. This describes how busy an area gets over time.
The number of crowds is calculated as the number of time periods in which the number of subscribers (i.e. the size of the crowd) exceeds a given threshold. Usually this is calculated as the number of crowds per day. This described the frequency with which crowds congregate in an area.
These indicators can be especially useful in the context of public health for identifying areas which may be hotspots for transmission of infectious disease or assessing the effectiveness of government restrictions designed to reduce the spread of disease.
Population mixing
By analysing subscriber counts, we can also derive metrics related to population mixing. This may refer to spatial mixing, which describes the number of people an individual might come into contact with, or temporal mixing, which describes the turnover of people at a location.
Spatial mixing
The spatial mixing of a population can be defined as the number of subscribers with a set of locations in common (i.e. have visited the same locations in the same time period). If more subscribers have the same locations in common, population mixing is higher.
Spatial mixing indicators can help characterise the connectivity between locations, and identify those visited by mostly the same people. This can be useful for optimising site selection for services, such as environmental surveillance sampling sites, as there is no need to select two sites which are visited by the same people. These indicators are also useful for predicting disease spread based on connectivity between places.
Temporal mixing
We can also capture mixing at a single location but over time, as the number of unique subscribers visiting an area in a new time period (turnover). This turnover in population is important for identifying mobility hotspots which can be important for understanding and modelling the geographic spread of infectious disease (places where, over time, large numbers of people may have interacted).
Discover our two main categories of dynamic population mapping indicators
Subscriber presence
Subscriber presenceHome location
Home location

